5.2 Confidence Limits
One of the strengths of statistics is that they quantify uncertainty about data. Confidence limits (sometimes called "confidence intervals") clearly illustrate that uncertainty, thus, regulators often require them. For example, confidence limits may be used to compare groundwater monitoring data to a fixed threshold, such as a compliance criterionGeneral term used in this document to identify a groundwater concentration that is relevant to a project; used instead of designations such as Groundwater Protection Standard, clean-up standard, or clean-up level., or for placing an upper limit on backgroundNatural or baseline groundwater quality at a site that can be characterized by upgradient, historical, or sometimes cross-gradient water quality (Unified Guidance).. Confidence limits are the maximum and minimum values bracketing the statistic of interest (usually the arithmetic or geometric meanA summary statistic calculated by multiplying the data values and taking the Nth root, where N is the sample size (science-dictionary.org 2013).) based on the distribution of the data (usually the normal or lognormalA dataset that is not normally distributed (symmetric bell-shaped curve) but that can be transformed using a natural logarithm so that the data set can be evaluated using a normal-theory test (Unified Guidance). distribution) at a certain confidence levelDegree of confidence associated with a statistical estimate or test, denoted as (1 – alpha) (Unified Guidance). (usually 95%). In other words, confidence limits are the maximum or minimum values above or below which you are confident (at a selected confidence level) that the statistic will occur. Confidence limits can be parametricA statistical test that depends upon or assumes observations from a particular probability distribution or distributions (Unified Guidance). or nonparametricStatistical test that does not depend on knowledge of the distribution of the sampled population (Unified Guidance).. For the calculation of parametric confidence limits, the underlying statistical distribution must be known in order to select the appropriate confidence limit. Certain more robust methods (e.g., calculation of robust confidence limits) may permit the calculation of confidence limits without removal of outliersValues unusually discrepant from the rest of a series of observations (Unified Guidance). within background data (USEPA 1999).
Parametric and Nonparametric Confidence Limits
Confidence limits can be parametric or nonparametric. For the calculation of parametric confidence limits, the underlying statistical distribution must be known in order to select the appropriate confidence limit.
To illustrate confidence intervals, suppose you must compare the meanThe arithmetic average of a sample set that estimates the middle of a statistical distribution (Unified Guidance). concentration of a contaminant in groundwater at a site to a protection standard. If you know the true mean of the entire population–all the groundwater at the site–then you can simply compare that value to the standard. The true mean, however, is never known. Usually, the mean is estimated from a measured sample (that is, the data set of groundwater concentration results), which is often a very small subset of the entire population. Estimating a parameter based on a sample always results in some uncertainty. A good way to account for this uncertainty is to estimate the upper and lower limits for the true mean based on the distribution of the data, the spread of the data, and a desired confidence level. For a given distribution, the confidence intervalStatistical interval designed to bound the true value of a population parameter such as the mean or an upper percentile (Unified Guidance). estimates a data interval within which, the actual statistic of the true population will fall, for a selected confidence level. For example, a 95% confidence interval of the mean chemical concentration in groundwater at a site means that if a group or network of wells was sampled 100 times, 95 of those times, the measured mean will fall within the calculated interval if the distribution model fits the data.Table F-1 includes information about checking assumptions for confidence limits. Confidence limits and tolerance limitsThe upper or lower limit of a tolerance interval (Unified Guidance). (see Section 5.3) are distinct, even though in some cases the one-sided upper limits for both methods are equivalent.
A confidence interval for a given data set may be calculated based on the sample statistic of interest, typically a mean or percentile, the sample standard deviation, the data distribution, and a selected level of confidence.
5.2.1 Determining Which Confidence Limits Are Needed
When using confidence limits, you must determine if one-sided or two-sided confidence limits are needed. This determination ensures that confidence limits are not over- or underestimated. If you are comparing data to a criterion and only need to know whether concentrations fall above or below a criterion, then only one of the confidence levels is of interest. The two-sided approach is appropriate when assessing the uncertainty of hydraulic parameters, such as the hydraulic conductivity estimates of a well.
Confidence intervals are often applied in the following scenarios:
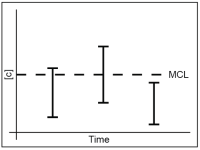
- Compliance or assessment monitoring where it is assumed that concentrations do not exceed a criterion and you must determine if concentrations have exceeded the criterion. In this case, a calculated lower confidence level (LCL) exceeding the standard, indicates confidence that the measured concentrations are above the criterion.
- Corrective action sites where it is assumed that concentrations exceed a criterion and confirmation must be provided that the site media have been remediated to concentrations below the criterion. In this case, a calculated upper confidence level (UCL) below the criterion, indicates that the criterion has been met.
- To determine the strength of evidence for an upward or downward trend in data, two sided confidence limits may be calculated for the estimated slope of the trend line. The calculation of two-sided confidence limits that do not include the value zero, are indicative of evidence of a trend at the selected confidence level (such as 95%).
Before calculating confidence limits, the data should be examined to evaluate what distribution fits the data, whether the underlying assumptions for constructing confidence limits are valid, and whether the selected confidence level is appropriate for the planned application (that is, the question you are trying to answer). Confidence limits may be constructed in several ways, depending on the distribution of the data and the question of interest, when assessing environmental data. Some common applications of confidence limits are listed below:
- Confidence interval around a normal mean. See Confidence Interval Around a Normal Mean (Chapter 21.1.1, Unified Guidance).
- Lognormal geometric mean. See Confidence Interval Around a Lognormal Geometric Mean (Chapter 21.1.2, Unified Guidance).
- Lognormal arithmetic meanThe sum of a list of numbers, divided by the number of values (Stark 2013).. See Confidence Interval Around a Lognormal Arithmetic Mean (Chapter 21.1.3, Unified Guidance).
- Upper percentile. See Confidence Interval Around an Upper Percentile (Chapter 21.1.4, Unified Guidance ).
5.2.2 Confidence Interval Around a Normal Mean
If the data are normally distributed, if the data pass normality tests (such as probability plots or the Shapiro-Wilk test), or are reasonably symmetric, choose the confidence interval around a normal mean. This method estimates the upper and lower confidence limits (UCL and LCL) around the arithmetic mean of a data set based on an underlying normal distributionSymmetric distribution of data (bell-shaped curve), the most common distribution assumption in statistical analysis (Unified Guidance). model. Construct a one-sided test instead of a two-sided test if that is most appropriate. These confidence intervals are most appropriate when comparing concentration means to criteria.
- This method is used when comparing normally-distributed concentrations to a criterion that is based on a mean, as is common in risk assessment.
- Confidence limits may be used to evaluate whether a mean concentration is above a mean-based criterion using theLCLlower confidence level, or below a mean-based criterion using the UCL.
- Study Question 1: What are the background concentrations ?
-
Study Question 3: Are concentrations above or below a criterion?
- The data must belong to a normal distribution.
- Data are stationaryA distribution whose population characteristics do not change over time or space (Unified Guidance).; there are no trends in the data or data characteristics over time.
- The criterion to which data will be compared is based on the mean.
- Check the data for normality and skewness before using. You can test for normality using a probability plot, correlation coefficient, or Shapiro-Wilk test.
- Use of a minimum of eight values is recommended, a larger data set may be required if data are skewed or contain nondetectsLaboratory analytical result known only to be below the method detection limit (MDL), or reporting limit (RL); see "censored data" (Unified Guidance).
- If a temporal component to the data exists, check that there is no temporal correlationAn estimate of the degree to which two sets of variables vary together, with no distinction between dependent and independent variables (USEPA 2013b). by using the autocorrelation function or the rank von Neumann ratio test.
- If you suspect a temporal trend, test for trends using a time-series plot, Mann-Kendall test, or linear regression.
- If you suspect outliers, examine the data using a probability plot, Dixon's test, or Rosner's test to further evaluate the suspected outliers.
- See Section 5.7 for information regarding treatment of nondetects.
- Select a level of confidence, such as 95%. This level of confidence may be determined by federal or state regulatory requirements or guidance, or by project-specific needs.
- Determine whether a one-sided or two-sided limit is necessary.
- The confidence interval decreases with larger sample sizes, thus helping to distinguish the statistic of interest from a criterion.
- The converse is that for small sample sizes, the confidence interval may be so wide as to not allow for identification of a statistical difference.
A description of how to construct and use confidence intervals is found in Chapter 8.3 and Chapter 21, Unified Guidance. A description of how to construct a confidence interval around a normal mean is given in Chapter 21.1.1, Unified Guidance.
5.2.3 Confidence Interval Around Lognormal Geometric Mean
Typical environmental data are not normally distributed but instead are heavily right-skewed. One way to handle these data is to transform them logarithmically. The transformed lognormal data may fit a normal distribution. The log-transformed data are no longer in the arithmetic domain, but the logarithmic domain.
Sometimes, it may seem easiest to simply log-transform the data, calculate the arithmetic mean of the log-transformed data, construct a confidence interval around this value, and then back-transform the confidence levels back to obtain the correct confidence interval. Unfortunately, this approach results in a confidence interval around the geometric mean, not the arithmetic mean, which usually results in an underestimate of the true mean. Be aware that a confidence interval calculated in this way may not meet regulations applicable to the site.
- This method is used when comparing lognormally-distributed concentrations to a criterion that is based on a mean, as is common in risk assessment.
- Confidence limits may be used to evaluate whether a mean concentration is above a mean-based criterion using theLCLlower confidence level, or below a mean-based criterion using the UCLupper confidence limit.
- Study Question 1: What are the background concentrations ?
- Study Question 3: Are concentrations above or below a criterion?
- After calculating the logs of the data, the resulting log-transformed data must belong to a normal distribution
- Data are stationary; there are no trends in the data or data characteristics over time.
- The criteria are based on the mean.
- Check the lognormal transformations of the data for normality and skewnessA measure of asymmetry of a dataset (Unified Guidance). before using them. You can test for normality using a probability plot, correlation coefficient, or Shapiro-Wilk test. If the lognormal data still do not fit a normal distribution, use a nonparametric confidence interval.
- Use of a minimum of eight values is recommended, a larger data set may be required if data are skewed or contain nondetects.
- If a temporal component to the data is present, check that no temporal correlation exists by using the autocorrelation function (ACF) or the rank von Neumann ratio test.
- If a temporal trend is suspected, test for trends using a time-series plot, Mann-Kendall test, or linear regression.
- If you suspect outliers, examine the data using a probability plot, Dixon’s test, or Rosner's test.
- See Section 5.7 for information regarding the treatment of nondetects.
- Select a level of confidence, such as 95%. This level of confidence may be determined by federal or state regulatory requirements, or guidance, or project-specific needs.
- Determine whether a one-sided or two-sided limit is necessary.
- The confidence interval decreases with larger sample sizes, thus helping to distinguish the statistic of interest from a criterion.
- The converse is that for small sample sizes, the confidence interval may be so wide as to not allow for identification of a statistical difference.
- This method may result in an underestimate of the mean.
A description of how to construct and use confidence intervals is found in Chapter 8.3 and Chapter 21,Unified Guidance. A description of how to construct a confidence interval around a lognormal geometric mean is given in Chapter 21.1.2.
5.2.4 Confidence Intervals Around Lognormal Arithmetic Mean
Confidence intervals about the arithmetic mean, the statistic commonly required by regulations, are useful for skewed, lognormal data. This method is appropriate when you need to compare your data to an arithmetic mean and the data fit a normal distribution when log-transformed. Be aware that the available procedures for constructing this type of confidence interval can produce unacceptable results. Land’s procedure is commonly used, but if the lognormal data have a high coefficient of variation, consider a bootstrapA computerized method for assigning measures of accuracy to sample estimates. This technique allows estimation of the sample distribution of almost any statistic using only very simple methods. Bootstrap methods are generally superior to ANOVA for small data sets or where sample distributions are nonnormal (USEPA 2010). confidence interval around the arithmetic mean.
- This method is used when comparing lognormally-distributed concentrations to a criterion that is based on a mean, as is common in risk assessment.
- Confidence limits may be used to evaluate whether a mean concentration is above a mean-based criterion using theLCLlower confidence level, or below a mean-based criterion using the UCLupper confidence limit.
- Study Question 1: What are the background concentrations ?
- Study Question 3: Are concentrations above or below a criterion?
- An important underlying assumption is that the after calculating the logs of the data, the resulting log-transformed data belong to a normal distribution
- Data are stationary; no trends exist in the data or data characteristics over time.
- The criteria are based on the mean.
- Check the lognormal transformations of the data for normality and skewness before using. You can test for normality using a probability plot, correlation coefficient, or Shapiro-Wilk test. If the lognormal data still do not fit a normal distribution, use a nonparametric confidence interval.
- It is recommended that a minimum of eight values be used, a larger data set may be required if data are skewed or contain nondetects. In addition, data that are poorly fit by a lognormal curve may produce upper confidence bounds that are unrealistic or inappropriate for comparison.
- If you suspect a temporal trend, test for trends using a time-series plot, Mann-Kendall test, or linear regression.
- If you suspect outliers, examine the data using a probability plot, Dixon’s test, or Rosner’s test.
- See Section 5.7 for information regarding the treatment of nondetects.
- Select a level of confidence, such as 95%. This level of confidence may be determined by federal or state regulatory requirements, or guidance, or project-specific needs.
- Determine whether a one-sided or two-sided limit is necessary.
- The confidence interval decreases with larger sample sizes, thus helping to distinguish the statistic of interest from a criterion.
- The converse is that for small sample sizes, the confidence interval for a lognormal arithmetic mean can be remarkably wide and require larger sample sizes than the confidence interval for a lognormal geometric mean to allow for identification of a statistical difference.
- This method may yield unacceptable results.
A description of how to construct and use confidence intervals is found in Chapter 8.3 and Chapter 21, Unified Guidance. A description of how to construct a confidence interval around a lognormal arithmetic mean is given in Chapter 21.1.3, Unified Guidance.
5.2.5 Confidence Interval Around Upper Percentile
Sometimes you must construct confidence intervals around a percentile. For example, if the criterion is a concentration that represents the 90th percentile, then a confidence interval around the upper 90th percentile should be calculated. If the standard is a fixed criterion, such as a “not to exceed” maximum, then it is appropriate to use a confidence interval around a high percentile, such as the upper 95th or 99th percentiles. Be cautious when selecting a percentile as it may be extremely difficult to demonstrate corrective action success if too high a percentile is selected.
- This method is used when comparing concentrations to a fixed criterion that is based on a percentile or maximum.
- An alternate background threshold value may be calculated based on the upper confidence level around an upper percentile.
- Confidence limits may be used to evaluate whether a mean concentration is above a mean-based criterion using theLCLlower confidence level, or below a mean-based criterion using the UCLupper confidence limit.
- Study Question 1: What are the background concentrations ?
- Study Question 3: Are concentrations above or below a criterion?
- An important underlying assumption is that the data belong to a normal distribution or can be normalized.
- Data are stationary; there are no trends in the data or data characteristics over time.
- The criteria are based on an upper percentile or fixed value, not a mean.
- Check the data for normality and skewness before using. You can test for normality using a probability plot, correlation coefficient, or Shapiro-Wilk test. If the data are not normal, check if the data can be normalized by a log or other transformation.
- Use of a minimum of eight values is recommended, a larger data set may be required if data are skewed or contain nondetects.
- If a temporal component to the data is present, check that no temporal correlation exists by using the sample autocorrelation function or the rank von Neumann ratio test.
- If you suspect a temporal trend, test for trends using a time-series plot, Mann-Kendall test, or linear regression.
- If you suspect outliers, examine the data using a probability plot, Dixon’s test, or Rosner’s test.
- See Section 5.7 for information regarding the treatment of nondetects.
- Need to select a level of confidence, for example, 95%. This level of confidence may be determined by federal or state regulatory requirements or guidance, or project-specific needs.
- Users should take care to note whether a one-sided of two-sided limit is necessary.
- Confidence intervals around a percentile do not suffer inaccuracies due to back transformation of log data.
- The confidence interval decreases with larger sample sizes, thus helping to distinguish the statistic of interest from a criterion.
- The converse is that for small sample sizes, the confidence interval may be so wide as to not allow for identification of a statistical difference.
- When testing that concentrations do not exceed a maximum value, a very high confidence level can make it difficult to demonstrate corrective action success.
A description of how to construct and use confidence intervals is found in Chapter 8.3 and Chapter 21, Unified Guidance. A description of how to construct a confidence interval around an upper percentile is given in Chapter 21.1.4, Unified Guidance.
5.2.6 Nonparametric Confidence Interval Around a Median or Percentile
If your data do not fit a normal, lognormal, or other distribution, or if there are too many nondetects, use of a nonparametric confidence interval is appropriate. Nonparametric methods do not assume a particular distribution. Unfortunately, this generally results in wider confidence intervals and the need for larger data sets for making confident decisions. This method is appropriate when comparing concentrations to a percentile, such as the medianThe 50th percentile of an ordered set of samples (Unified Guidance). (50th percentile) or 90th percentile. If you need to compare concentrations to a maximum criterion, a large percentile, such as the 95th or 99th percentile may be applied.
- This method is used when comparing concentrations to a fixed criterion that is based on the percentile or median.
- Confidence limits may be used to evaluate whether a mean concentration is above a fixed criterion using theLCLlower confidence level, or below a fixed criterion using the UCLupper confidence limit.
- Study Question 1: What are the background concentrations?
- Study Question 3: Are concentrations above or below a criterion?
- The criteria are fixed.
- The sample size is sufficient to achieve the desired confidence level.
- Data are stationary; there are no trends in the data or data characteristics over time.
- The confidence level depends on the sample size. It may be necessary to increase the sample size in order to make decisions at a desired confidence level.
- Use of a minimum of eight values is recommended, a larger data set may be required if data are skewed or contain nondetects. In addition, it is likely that more than eight values will be needed for the required confidence level.
- Select a level of confidence, such as 95%. This level of confidence may be determined by federal or state regulatory requirements, or guidance, or project-specific needs. This confidence level may not be attainable if the sample size is too small.
- See Section 5.7 for information regarding the treatment of nondetects.
- Determine whether a one-sided of two-sided limit is necessary.
- No particular distribution is needed; this method will work on most data sets.
- The confidence interval decreases with larger sample sizes, thus helping to distinguish the statistic of interest from a criterion.
- The converse is that for small sample sizes, the confidence interval may be so wide as to not allow for identification of a statistical difference. For a small data set, the confidence level may be so low as to provide little value for making decisions.
- You may need a large data set to achieve the desired confidence level.
A description of how to construct and use confidence intervals is found in Chapter 8.3 and Chapter 21, Unified Guidance. A description of nonparametric confidence intervals is given in Chapter 21.2, Unified Guidance.
5.2.7 Confidence Interval Band Around Linear Regression Lines
If a linear trend is present in your data, you can describe the uncertainty in these data by constructing a confidence band around the trend line over the rangeThe difference between the largest value and smallest value in a dataset (NIST/SEMATECH 2012). of the data set. The confidence band is constructed of the individual confidence intervals around the mean as a function of time, not an upper percentile. This method is most appropriate for cases where the fixed criterion represents a mean concentration and not an explicit upper percentile or “not to exceed” value.
- This method estimates the confidence intervals around a trend line.
- Confidence limits may be used to characterize the uncertainty in the slope when estimating attenuation rates.
- Study Question 1: What are the background concentrations?
- Study Question 7: What are the contaminant attenuation rates in wells?
- The residuals from the regression are approximately normal or reasonably symmetric.
- The variation about the mean should not be increasing or decreasing (that is, it should be stationary).
- Enough data exist to not only estimate the trend, but also to compute the varianceThe square of the standard deviation (EPA 1989); a measure of how far numbers are separated in a data set. A small variance indicates that numbers in the dataset are clustered close to the mean. around the trend line.
- Few if any nondetects are present.
- A linear trend exists.
- After fitting the regression line, test that the residuals from the regression are approximately normal or reasonably symmetric using a probability plot, correlation coefficient, or Shapiro-Wilk test.
- Plot the residuals versus concentrations. Check that the resulting scatter cloud is essentially uniform in vertical thickness or width, that is there is no tendency of the cloud to increase in width with concentration, or that the scatter cloud exhibits any kind of regular pattern.
- Use of a minimum of 8 to 10 data points, with few if any nondetects, is recommended; a larger data set may be required if the data are skewed or contain nondetects.
- The data are not required to be normal or lognormal, however the residuals are assumed to be normal.
- A large number of confidence intervals comprising the confidence band will not result in an increase in the false positive rateThe frequency at which false positive or Type I error occurs. The false positive rate, or α (alpha), is the significance level of a hypothesis test. If a test is at an α = 0.01 level of significance there would be a 1% chance that a Type I error would occur (Unified Guidance)..
- If the variability changes along the trend, a wider confidence interval results.
- This method provides a graphical assessment of the uncertainty around a trend line.
A description of how to construct and use confidence intervals is found in Chapter 8.3 and Chapter 21, Unified Guidance. A description of parametric confidence band around linear regression is given in Chapter 21.3.1, Unified Guidance.
Publication Date: December 2013